
by Ellen M. Taylor, AIA, MBA, EDAC
Published by The Center for Health Design, 2009
Recent history has shown an unprecedented healthcare building boom with $194.5 billion in current dollars spent on healthcare construction from 2004 through 2008 alone. (Jones, 2009) According to the American Institute of Architects (AIA), the recent economic downturn has only modestly slowed construction in healthcare relative to other industries and forecasts indicate that the healthcare industry may be one of the first to recover. (Baker, 2009) AIA Chief Economist Kermit Baker, PhD, Hon. AIA also projects that the healthcare industry will decline less than five percent in the two-year period of 2009-10 (-3.6 percent in 2009 and -0.9 percent in 2010), while the commercial sectors of office, retail and hotels may experience a decline of 25-35 percent in the same period.
According to an analysis conducted by RSMeans Business Solutions, even with the current economic downturn, a total of $40.7 billion in hospitals and clinics was under construction at the start of the fourth quarter of 2008. This was nearly identical to the $41 billion of activity the same time period one year earlier. (Carpenter, 2009)
1.0 Background
While the field of evidence-based design (EBD) field has grown significantly over the last few years, we do not know how much of this knowledge and increased awareness is being translated into the design of new healthcare facilities. How many healthcare projects use an EBD process? Are those planning and designing these facilities coming up with innovative design solutions to address key safety and quality issues in healthcare settings? Are they measuring the impacts of these changes? Is EBD really making a difference?
Working with Herman Miller Healthcare as a corporate partner, the Center for Health Design has completed the first Survey of Design Research in Healthcare Settings. With participation from a diverse group of stakeholders involved in the healthcare design process, the results provide insight into many questions surrounding the use of research in healthcare design and will set a benchmark for future analysis of industry trends.
To measure these trends, the survey questions were structured around general categories including:
- Awareness (design research and evidence-based design)
- Information Sources (design strategies, healthcare design trends)
- Acceptance (definition, personal and industry opinions)
- Applications of EBD Features (use of specific design features and interventions)
- Data Collection (formal research, methods, analysis) and
- Dissemination (how is information shared)
This report of survey results is organized around the same topics.
In the Health Facilities Management/ ASHE 2009 Construction Survey, Robert D. Levine, senior vice president for health care at New York-based Turner Construction Company states “We see a tremendous amount of evidence-based design being incorporated into drawings as standard practice. It’s no longer a matter of convincing anybody. But I think that this market is now challenging anything that doesn’t really have science behind it.” In 2008, 21 percent of capital budgets were allocated to new construction/ facility modernization (Carpenter, 2009). With an outlook for 2009 described by Levine as “fragile,” it may be more important than ever to use evidence based design processes and features to ensure the best investment of limited funds.
Respondent Demographics
Those responding to the survey included: architects, interior designers, researchers, hospital facility-related staff (including facility managers/ directors and staff project managers), healthcare consultants, medical planners, hospital administration (including C-Suite and non-facilities related leadership), and miscellaneous other categories such as vendor/product sales rep, business development/ marketing, construction managers, post-graduate degree candidate (PhD, Masters), and clinicians. (Figure 1: Demographics)
Many respondents also indicated prior roles within the industry, which have the potential to create a varied and broad perspective within the field of healthcare design. The most career movement was present with those who had prior experience as architects, clinicians (i.e. physicians, nurses), and healthcare consultants; the most varied transitions occurred within healthcare consulting.
Architects transitioned into roles as developers, hospital project management, medical planners, owner’s representatives, or academic researchers. Clinicians typically indicated a transition to roles in executive levels (C-Suite), hospital leadership, hospital facility project management/ leadership, or clinical researchers. Former healthcare consultants had moved into roles as clinicians, developers, medical planners, non-facilities related hospital leadership, and academic, as well as clinical researchers.
While the field of healthcare design can benefit from the practical experience of a nurse practicing interior design, or an architect conducting academic research, survey results indicate these types of crossovers are still quite rare.
Most respondents indicated more than 15 years in the healthcare industry (58 percent) with more than a third (38.6 percent) indicating more than 15 years in their current role. A third of respondents hold an executive leadership role within their organization, while 38 percent manage and direct others. (Figure 2: Experience)
Of the respondents, 90 percent indicated recent involvement with one or more healthcare design projects. Of those who were not involved in projects, seven percent expressed an interest in learning more about how design research could impact healthcare-related outcomes.
Awareness
According to a recent construction survey, evidence-based design gained support in 2008, although a large number of hospitals still aren’t using EBD features. (HFM/ASHE 2009 Construction Survey) The same survey indicated 22 percent were applying EBD design concepts in all construction projects and 40 percent for some projects.
In this survey focusing specifically on the use of design research in healthcare settings, nearly all of those surveyed were aware of design research to indicate improved healthcare-related outcomes. (A primary interpretation of design research is that it is concerned with undertaking research into the design process.) (Wikipedia 2009) More than 80 percent of respondents stated they “sometimes” or “regularly” used design research to make their decisions. (Figure 3: Research Awareness)
Those participating in design teams were also asked about the awareness of the term “evidence-based design.” Similar to the results for awareness of design research, a majority of respondents indicated regular use of evidence-based design. (Figure 4: Awareness of EBD Terminology) However, fewer respondents indicated using EBD “sometimes,” while more indicated hearing about EBD but “not trying to use it yet.”
Information Sources
Respondents were asked about information sources used to gather information about design strategies.
The top two “always” used sources of information include: Internet searches for materials or other projects (43.8 percent) and past projects (38.8 percent). (Figure 5: Healthcare Design Resources Used All of the Time)
The least used sources of information were blogs, webinars, and online literature databases (EBSCO, PubMed, etc). (Figure 6: Use of Healthcare Design Resources)
Respondents were also asked about resources used most often for information about healthcare design. By far, the most used resources for information include the Guidelines for the Design and Construction of Healthcare Facilities (50.7 percent) and HEALTHCARE DESIGN magazine (43.4 percent). (Figure 5: Healthcare Design Resources Used All of the Time)
The least awareness for resources surrounded the (newer) Global Health and Safety Initiatives (RIPPLE database), the Institute for Family Centered Care, and InformeDesign. (Figure 6: Use of Healthcare Design Resources)
Acceptance
There is often discussion, even between industry proponents, about the use of “evidence-based design” – the availability and credibility of evidence, the use of the term for projects using a legitimate EBD process rather than just marketing jargon, and perceptions about aesthetics versus tangible outcomes. In 2008, the Wall Street Journal’s Informed Patient Column stated, “Evidence-based design is not without controversy. With many patients lacking insurance, and the costs of care spiraling, some critics question whether spending on aesthetic features is the best use of money, especially when it is hard to prove they do any good.” (Landro, 2008) What is important about evidence-based design, however, is a process of design and the specific and tangible outcome associated with the design – not just aesthetics or patient-oriented “perks.”
Misconceptions about evidence-based design may often result from EBD not being well defined, even within the industry. The Center for Health Design defines EBD as “the process of basing decisions about the built environment on credible research to achieve the best possible outcomes.” (The Center for Health Design, 2008)
To determine understanding of the term, the survey posed a question about opinions for the best definition of EBD. Results indicate a familiarity with the formal definition posited by CHD, but many also feel that EBD uses a combination of sources and information. (Figure 7: Defining EBD)
The clarity about EBD is especially absent when requested as part of a design Request for Proposal (RFP). For those survey respondents issuing and receiving RFPs, 69 percent felt that the requirements for EBD were “never” or “rarely” defined.
With respect to perceptions about evidence-based design, survey participants were asked about both their personal opinions on the subject, as well as overall industry perceptions. Personal opinions were highly correlated to the suggested positive responses including viewing EBD as a way to: improve outcomes, make informed decisions, improve the quality of life in healthcare, and improve safety. It was also perceived as a forward-thinking trend, a way to preserve design intent during value engineering, a way to reduce long-term costs, and a competitive advantage for organizations. (Figure 8: Personal Opinions) It was not felt that EBD is a waste of money, a marketing gimmick, a passing fad, or a just a way to meet RFP requirements.
One criticism of EBD, even among proponents of the practice, is the accessibility of evidence and the lack of rigorous studies for many of the design decisions required. Survey results indicate an almost even split between respondents about the availability of information.
Aside from personal opinions, respondents were also asked to gauge industry perceptions about EBD. While no one felt the perception was all negative, very few felt it was all positive, with most responses trending toward a positive perception. (Figure 9: Industry Perceptions)
Applications of EBD Features
One of the primary goals of the survey is to determine the extent to which evidence is being incorporated into the design and construction of healthcare facilities by measuring trends over time.
The top general EBD features being incorporated into healthcare facilities all of the time are a healing environment that is nurturing, therapeutic, and reduces stress (60 percent), surfaces and finishes to reduce contamination (57.7 percent), integrated wayfinding of pre-arrival information, maps/ guides, and signage (50.8 percent), and alcohol-based hand-rub (gel) dispensers (50.1 percent). (Figure 10: EBD Features Used All of the Time)
The features used least are noiseless paging systems, healing gardens accessible by patients, families and staff , and daylight in staff support areas (34.6 percent).
The EBD features specific to inpatient units “always” used included: private (single-bed) patient rooms (60.4 percent), highly visible hand wash sink locations (57.6 percent), surfaces and finishes to reduce falls (54.6 percent), and patient rooms with designated zones for patients, families and clinicians (52.3 percent). (Figure 10: EBD Features Used All of the Time) The least-used features included ceiling-mounted or mobile patient lifts and acuity-adaptable rooms (standardized in shape, size and headwall to eliminate the need to move patients as their condition changes).
Specific data are shown indicating overall use for those working on multiple project and those working on a single project (or single project with several enabling projects). (Figure 11: Overall Use of EBD Features)
While not limited responses to evidence-based interventions, as a point of reference, the 2009 ASHE Survey results indicated the top five design features being incorporated into facilities to improve safety were: multiple locations for hand washing or hand sanitizing, added air treatment/ air movement capacity, decentralized nurse stations, use of noise-reducing construction materials, and multi-functional lighting systems. The top five features being incorporated into patient rooms included: wireless technologies for staff, individual room temperature control, in-room sink (separate from the bathroom), computerized provider order entry, and larger room size (200 SF or more). (Carpenter, 2009)
2.0 Data Collection
Another important baseline metric of the survey are the types and use of research design and the trends to expanding the body of knowledge with new credible EBD research in the field. Of those participating in the planning and design of a healthcare facility, two-thirds indicated their organization conducted formal research to assess the relevance of design strategies for a particular project.
Respondents were questioned about the generation of several items during the design and planning of a project to determine how often the initial phases of research were undertaken during a project. The results of the survey show that many respondents “always” form a hypothesis about how a design feature may improve an outcome (65.6 percent). While some always set measurable goals (43.3 percent), fewer respondents consistently create data reports to inform a design decision (34.4 percent), develop specific performance measure to quantify the results of design decisions (26.3 percent), or create literature reviews about existing research (25.8 percent). (Figure 12: Considering Research During Design)
When asked about the types of methods used to evaluate design strategies during the planning and design process, the responses indicated nearly everyone reviews past projects (88.2 percent), tours and benchmarks other facilities (86.1 percent), and learns about past and current research related to a specific design feature (86.1 percent). However, only half (49.8 percent) indicated they reviewed, evaluated, and summarized research into a formal written report (conduct a systematic literature review). (Figure 13: Evaluating Strategies and Measuring Results)
After completing a project, the most common method used to measure the effectiveness of results against predefined measures was by far a post-occupancy evaluation (71.6 percent). Interestingly, this was a lower rated item for gathering evidence about design strategies in the early phases of a project. Other frequently-used methods to measure results included before and after studies (46.5 percent) and focus groups (36.1 percent). (Figure 13: Evaluating Strategies and Measuring Results)
Potentially more rigorous study types, such as prospective studies (18.5 percent), natural experiments (16.2 percent), or randomized control studies (9.1 percent) are less common. Moreover, nearly one quarter of respondents (23.2 percent) indicated the design results are never formally evaluated following project completion.
3.0 Data Dissemination
Another important component of any type of research is the dissemination of data and findings. While all queried methods receive varying rates of use, the responses indicate evidence being generated by healthcare providers and their design teams is most often not shared outside of the immediate team. The three most common ways that information is always shared include: project debriefings (20 percent), internal staff lunch and learn (16 percent), and hospital leadership team meetings (13 percent). (Figure 14: Disseminating Findings)
Another way of interpreting the data is to look at the methods “never” used to share specific outcomes or results. These include webinars (54 percent), peer-reviewed journals (38 percent), industry association events, such as an AIA lunch and learn (33 percent), and interviews with local media (33 percent).
4.0 Discussion
Brief discussions of the survey implications follow for each area.
Awareness (Figures 3-4)
The surveyed audience seems to be well aware of design research in healthcare with nearly 85 percent of respondents indicating some use of design research. However, when asked specifically about evidence-based design, only 56.5 percent indicated using this process. The lack of alignment with these two questions may indicate confusion about what constitutes research and/ or evidence-based design. Conversely, this result can also be encouraging; those participating in the survey appear to be careful about claiming use of evidence-based design as a casual reference.
Information Sources (Figures 5-6)
Based on the findings, it is clear that a more traditional and possibly less rigorous approach to investigating design strategies is still in place. Results indicate there is limited use of more “credible” design research in the industry, such as published research, summaries, or online databases. However, even “traditional” methods that have been used for years in the field of design (i.e. site visits, mock-ups, prototypes) can be more rigorous and credible in an EBD process. For example, the selection of facilities for site visits can be carefully considered for purpose and goals, with specific questions developed for varied stakeholders at the visited facility. Debriefing meetings can find all attendees having a focused discussion about the targeted issues. Pilot testing and mock-ups should be conducted early in the design process to test hypotheses and allow changes before the project is under construction. While these processes are not necessarily new to the field, the level of conscientious decision-making and subsequent documentation is probably more intense than most teams have undertaken in the past.
With respect to use of specific information sources, it is not surprising that the Guidelines for the Design and Construction of Healthcare Facilities appears as a top resource, as its use is required in nearly all states of the United States. (Some international participants indicated they used their country’s equivalent as a resource.) Due to the survey distribution, it is also not surprising, that Vendome’s HEALTHCARE DESIGN magazine and conferences were some of the more commonly used resources used to gather information for healthcare design strategies.
Acceptance (Figures 7-9)
The responses indicated a much wider view of evidence-based design than may be promoted by many leaders in the field. With 40 percent of respondents indicating EBD is a combination of all of the offered responses, the range of evidence being considered may fall below the rigor of what may be deemed credible research.
While the positive correlation of positive opinions and responses is encouraging, it is still of concern that more than half of the respondents felt that EBD was something people said they did, but didn’t really do.
Application of EBD Features (Figures 10-11)
Due to the nature of confounding variables, there may always be some debate about what evidence is required to support the benefit of a design intervention and what constitutes an EBD feature. Putting the debate aside, it is encouraging that of those features included in the first year survey, several of the most-used features included in facilities all of the time are those that support improved safety and the reduction of nosocomial infections (i.e. single-bed rooms, hand-washing hygiene measures). However, while there has been fairly extensive discussion about these issues and regular use of these features is half the time or more, there is still room for growth.
More dramatic areas of growth exists in areas with indicators for staff efficiency and patient and staff safety such as decentralized nursing and supplies, acuity adaptable rooms and lifts. Quality of care features that may promote reduced length of stay, reduced stress, and improved satisfaction (i.e. art of nature settings, healing gardens accessible to staff, patients and families, and acoustical control of the environment) are also areas where usage can show significant growth.
Data Collection (Figures 12-13)
Due to the responses indicating the items generated by the design team during the planning and design and the use of methods to evaluate design strategies, the survey implies shortcomings in the area of generating and collecting data. The irony is that most design teams have always had underlying ideas (hypotheses) when they design a facility; they are inherently being hired to solve a problem.
Those learning about design research may not read or have access to the full study and therefore may spend less time understanding all of the implications of a published study. A lack of discipline may exist when only a few design teams create a literature review, summary report, or report of data to inform the decision-making process. In addition, beyond the study’s credibility, it is important for the team to understand whether the study is appropriate and applicable to other situations. It is also crucial to evaluate the effectiveness (both cost and healthcare-related outcome) for the provider organization and patients.
Helping the design team evaluate research and understand how to turn design ideas into research questions and study designs is a current gap in the process. As this is a newer area of healthcare design requiring additional interdisciplinary team members trained in interpreting and designing research, these results should improve over time.
Data Dissemination (Figure 14)
Unfortunately, the survey indicates a paucity of consistently sharing findings, outcomes, and research results - even among industry professionals. The fifth and sixth “most used” methods of sharing information (conference presentations and white papers) do not provide as robust a means of dissemination as publication. Few conference presentations portray the full breadth of study design and white papers can also be limited in detail.
However, the limited submission to peer-reviewed journals is of most concern. Less than five percent always submit papers for publication and 38 percent never submit papers for publication. While the time required to submit an article to a peer-reviewed journal may be more time consuming than some of the other methods, it is also often considered one of the best ways to provide credibility to a study.
Limitations
In the first year of the survey, limitations included the targeted audience, participation rate and demographics. While the number of responses was encouraging for a first-year survey, the audience was heavily weighted toward those already familiar with the work of The Center for Health Design and venues that regularly promote the use of research in healthcare design, such as HEALTHCARE DESIGN magazine and the HEALTHCARE DESIGN conference, both produced by the Vendome Group. The incentive of a 50 percent discount at The Center for Health Design Store for publications may have also influenced the type of participant.
With the invited audience creating a potential survey bias, a further analysis was conducted to consider self-selection bias. In considering levels of experience in current roles, experience in healthcare overall, and the type of role, the responses were fairly consistent across all categories of respondents and questions. While the cross tabulation analysis did not reveal additional bias, those with less than one year experience tended to be less aware of design research and evidence-based design and those with more experience were more likely to use design research.
As survey announcements were typically included in an e-newsletter with other announcements, events, and stories, the click-through rate was typical of such blanket-announcement surveys. However, the one-time use of a single announcement through the HEALTHCARE DESIGN list generated more respondents than all of the other announcements.
The demographics are skewed to the consulting design team participants. Future years will endeavor to reach a larger audience through additional outreach to other professional and trade organizations for additional participation from decision makers, clinicians, staff, and facility managers within the provider organizations.
5.0 Conclusions
The first year’s results provide both positive and negative results. On the positive side, two-thirds of respondents are using design research in their work. There are also many of healthcare design professionals and providers who are aware of evidence-based design and practice what many fields would deem credible research methodologies. In addition, the perceptions about evidence-based design are highly positive, although there is an acknowledge concern about the availability of information upon which to judge the field.
However, the results also seem to indicate that many teams do not complete a full research process, whether due to lack of resources, initiative, or other reason. When research is completed, the survey results imply the findings are not widely shared.
The irony is that most design teams have underlying ideas (hypotheses) when they design a facility; they are inherently being hired to solve a problem. Helping the design team understand how to turn these ideas into research questions and study designs may prove to be the current gap in the process, as this is a newer area requiring additional interdisciplinary team members trained in interpreting and designing research.
In addition, while it appears many teams are still using traditional methods to evaluate the information and, it is important in the practice of evidence-based design to process information and evidence in a conscientious and diligent manner, documenting all considerations and decisions along the way.
With many projects on hold awaiting the economic recovery, there are ample opportunities to learn about the research, revisit project decisions, and benefit from the chance to evaluate any options that may have previously been passed by with accelerated time lines and unrealistic deadlines. Slow times and necessity can become the mother of innovation.
6.0 References
Baker, K. (2009, January 16). AIArchitect This Week | With Economy Mired in a Deep Recession, Nonresidential Construction Activity Projected to Decline Sharply. Retrieved May 10, 2009, from http://info.aia.org/aiarchitect/thisweek09/0116/0116n_consensus.cfm.
Carpenter, D. (2009). Boom Going Bust? Health Facilities Management, 22(2), 11-18.
Jones, H. (2009, March 10). FMI’s Construction Outlook: First Quarter 2009 Report | FMI Corporation. FMI: Raleigh, NC. Retrieved June 8, 2009, from http://www.fminet.com/article/534.
Landro, L. (2008, August 20). A Treatment Room With a View - WSJ.com. Wall Street Journal, D1.
The Center for Health Design. (2008). Definition of Evidence-Based Design for Healthcare. Retrieved March 24, 2009, from http://www.healthdesign.org/aboutus/mission/EBD_definition.php.
Wikipedia. (2009). Design research. Retrieved May 26, 2009, from http://en.wikipedia.org/wiki/Design_research.
7.0 Methodology
The 15-20 minute survey was conducted for six weeks online, commencing in December 2008 and closing in February 2009. The survey was developed in conjunction with an Advisory Council (AC) that reviewed the framework, respondent categories, topic areas, and questions. The review was conducted through conference calls and online testing, where the AC could append comments to any question, follow multiple paths for varied respondent types, and test skip logic areas. A group of approximately 25 beta testers were invited to take the survey in late December to validate the amount of time to take the survey.
The survey was announced through several e-mail lists, including the Vendome weekly HEALTHCARE DESIGN e-News, The Center for Health Design e-newsletter, the Pebble Project list, and the EDAC (Evidence-Based design Certification and Accreditation) news flash. A small number of e-mails were sent to individual contacts from personal address books, and a blog URL on The Center’s website was posted to a social network of AIA members. The combined lists total approximately 20-22,000 potential respondents, with more than 600 taking the survey for a response rate of three percent. The completion rate of the survey was more than 85 percent.
Based on the respondent role (i.e. architect, vendor, academic researcher, etc.), questions were posed about participation in healthcare design projects. (See also Figure 1: Demographics.) Those involved in recent projects were asked a series of questions about activities during the planning, design, and completion of a project. Certain responses triggered skip logic to applicable areas of the survey. Those not involved in a recent project were asked several generic questions related to topics of public awareness and interest. Based on the responses and associated skip logic, participants were provided with percentage complete at selected points throughout the survey.
Questions with more response choices required a minimum number of responses to the lists (i.e. choose a minimum of five out of ten to fifteen selections). Some questions provided areas for open-ended responses. This was primarily to determine if specific responses were missing from the survey.
To avoid participant fatigue and potential drop-out, two longer questions pertaining to use of specific design features were incorporated as the last questions of the survey. Included features were limited to those with available evidence to support an improved outcome. Respondents could “write-in” features felt to be important but not part of the multiple choice selections.
An incentive of a 50 percent discount on publications available through The Center for Health Design store was offered to all of those completing the survey. The discount code was only generated for those who were directed through to the last page of the survey.
Data was exported from Survey Monkey into a Microsoft Excel compatible file and subsequently imported into SPSS. A combination of a Survey Monkey, Excel, and SPSS were used to complete data analysis which included descriptive statistics, cross tabulations, and interactive graphs.
8.0 Acknowledgements
This survey would not have been possible without the generous support of corporate partner, Herman Miller Healthcare.
The Advisory Council was indispensable through their review and commentary on the survey development. Participants included (in alphabetical order):
Judene Bartley, MS, MPH, CIC, Epidemiology Consulting Services
Rosalyn Cama, FASID, EDAC, CAMA Incorporated
Kerrie Cardon, RN, AIA, ACHA, Herman Miller Healthcare
Kent Gawart, Herman Miller Healthcare
Debra Levin, EDAC, The Center for Health Design
Ed Ponatoski, Martin-Blanck & Associates
Bill Rostenberg, FAIA, FACHA, Anshen + Allen Architects
Katherine Smith, MPH, Samueli Institute
Joseph G. Sprague, FAIA, FACHA, FHFI, HKS, Inc.
Jaynelle F. Stichler, DNSc, RN, FACHE, FAAN, San Diego State University
Craig Zimring, PhD, Georgia Institute of Technology
Staff from The Center for Health Design providing support, direction, and guidance for the project included:
Anjali Joseph, PhD, EDAC, Director of Research
Amy Beth Keller, MArch, EDAC, Research Associate and Pebble Design Strategist
Natalie Zensius, Director of Marketing and Communications
Callie Fasholz, EDAC, Project Manager
Pamela Cheng, Marketing Manager
FIGURES
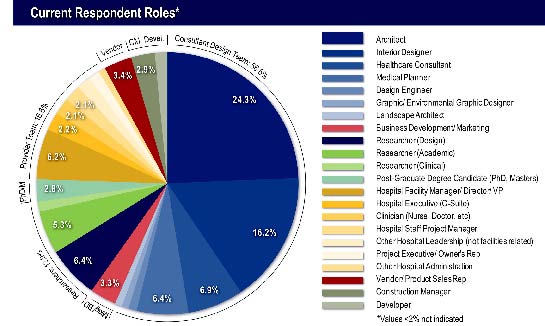
FIGURE 1: Demographics

FIGURE 2: Experience
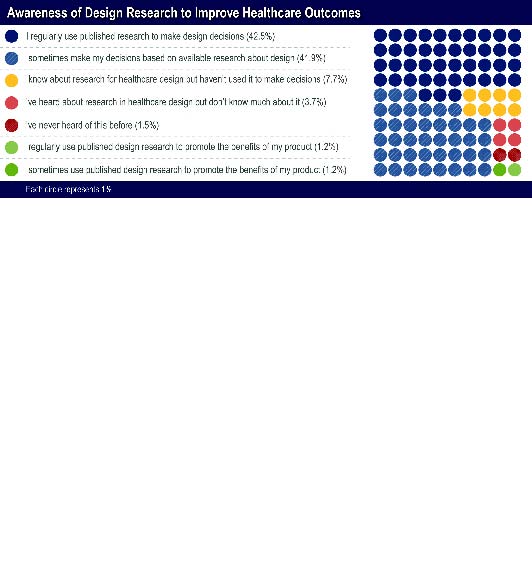
FIGURE 3: Research Awareness
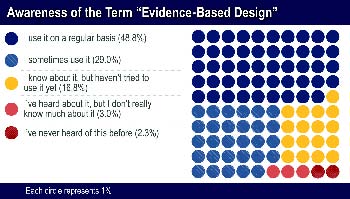
FIGURE 4: Awareness of EBD Terminology
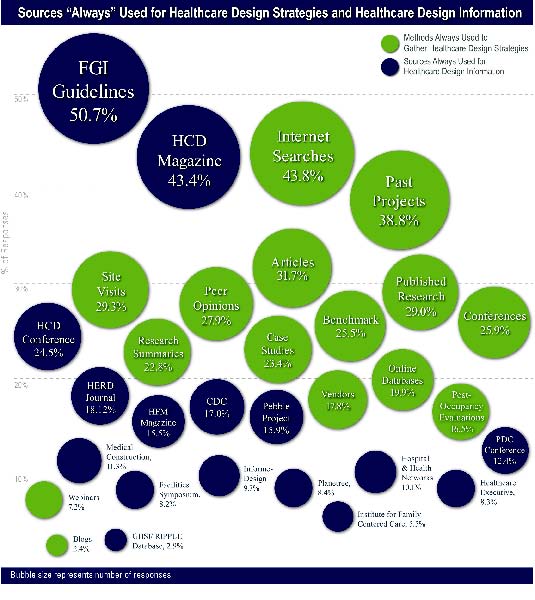
FIGURE 5: Healthcare Design Resources Used All of the Time
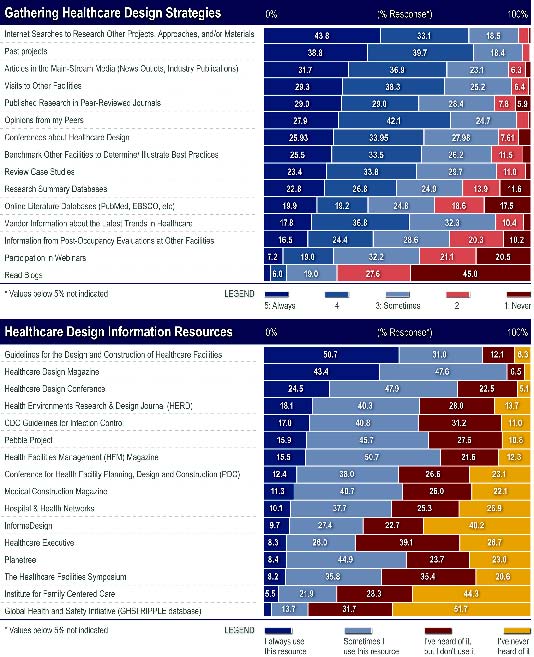
FIGURE 6: Use of Healthcare Design Resources
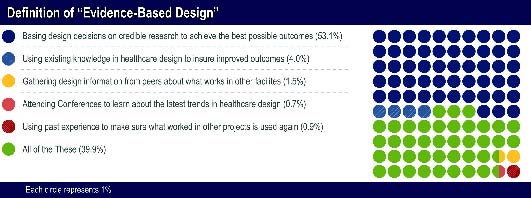
FIGURE 7: Defining EBD
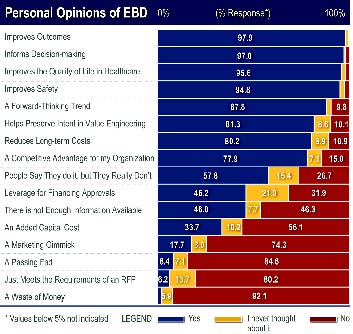
FIGURE 8: Personal Opinions
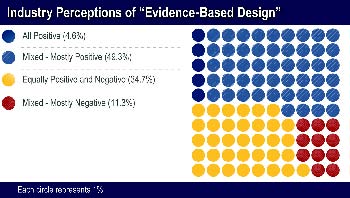
FIGURE 9: Industry Perceptions
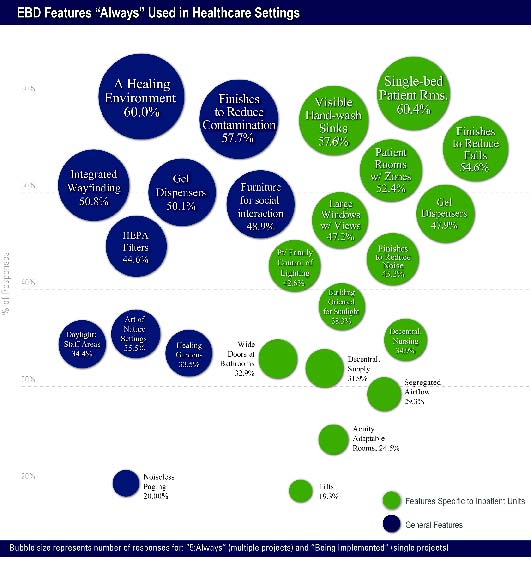
FIGURE 10: EBD Features Used All of the Time

FIGURE 11: Overall Use of EBD Features
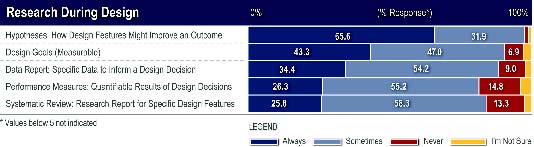
FIGURE 12: Considering Research During Design
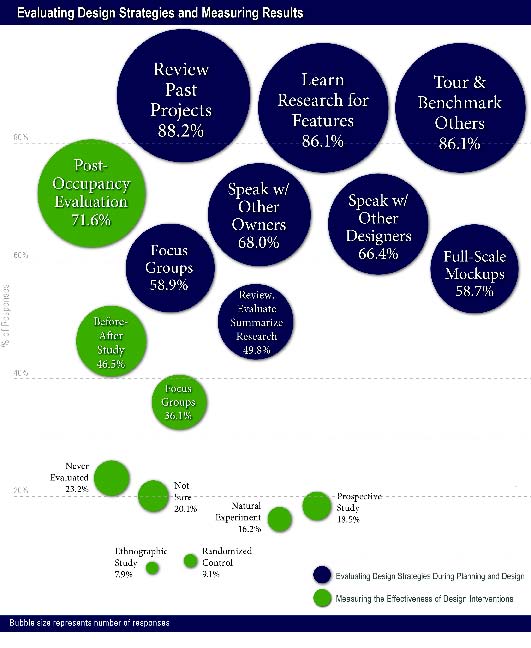
FIGURE 13: Evaluating Strategies and Measuring Results
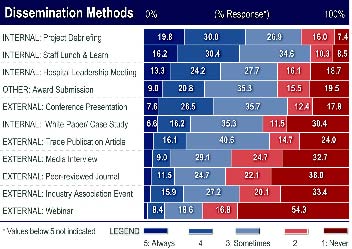
FIGURE 14: Disseminating Findings
Copyright © 2009 by The Center for Health Design, Inc. All rights reserved. No part of this work covered by the copyright herein may be reproduced by any means or used in any form without written permission of the publisher.
The views and methods expressed by the authors do not necessarily reflect the opinions of The Center for Health Design, or its Board, or staff.
| Attachment | Size |
|---|---|
 Download PDF | 14.43 MBpdf Download PDF | 14.43 MBpdf | 14.43 MB |